Harris-Benedict Equation | Original Formula, 1984 Revision, and How It Calculates TDEE
The Harris-Benedict equation estimates BMR using weight, height, age, and sex. Learn both the original and revised formulas, worked examples, TDEE outputs at all activity levels, and how it compares to Mifflin-St Jeor.
The Harris-Benedict equation is a Basal Metabolic Rate (BMR) formula published in 1919 by James Arthur Harris and Francis Gano Benedict at the Nutrition Laboratory of the Carnegie Institution of Washington. It was the primary BMR formula used in clinical nutrition, hospital settings, and research for over 60 years. A revised version correcting systematic overestimation errors was published in 1984 by Roza and Shizgal.
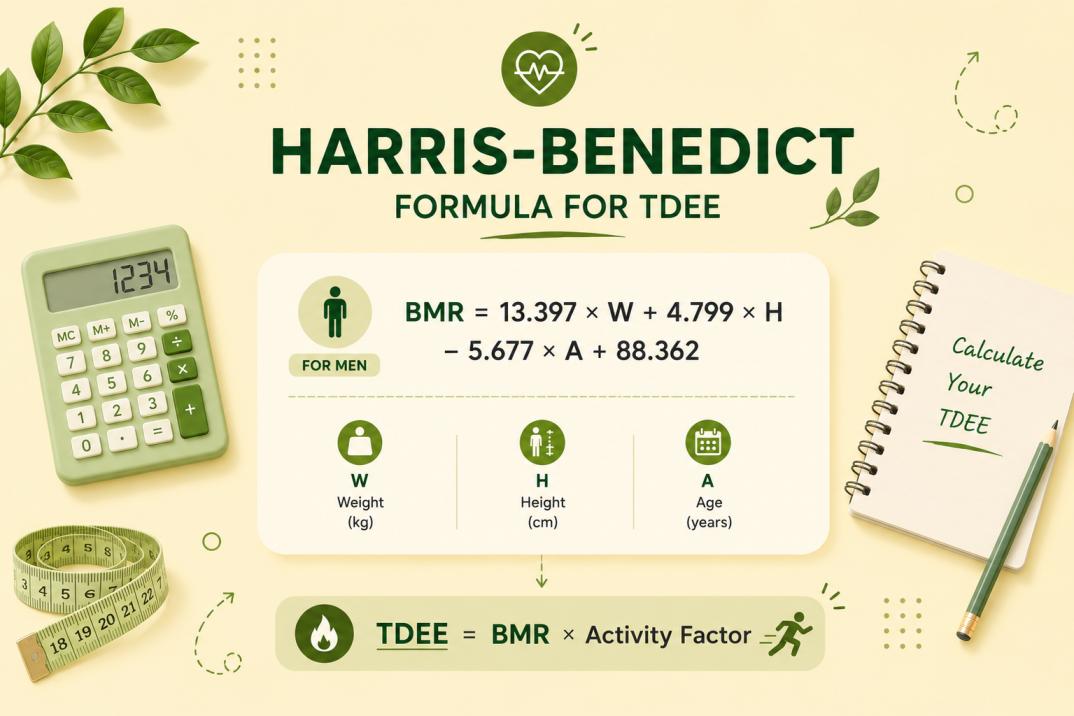
BMR from the Harris-Benedict equation is multiplied by an activity multiplier to produce Total Daily Energy Expenditure (TDEE), the total calories burned per day across all activity. The formula uses four inputs: body weight in kilograms, height in centimeters, age in years, and biological sex. It applies separate coefficient sets for males and females, unlike the Katch-McArdle equation, which uses lean body mass and is sex-neutral. To run a live TDEE calculation, use the TDEE Calculator.
This article covers both versions of the Harris-Benedict formula with full coefficient tables, step-by-step worked examples at multiple body weights, TDEE outputs across all five activity levels, and a direct comparison against the Mifflin-St Jeor equation.
What Is the Harris-Benedict Equation?
The Harris-Benedict equation estimates the number of calories the body burns per day at complete rest. This value, called Basal Metabolic Rate or Resting Energy Expenditure (REE), is the calorie floor that keeps the heart beating, lungs breathing, brain functioning, and core temperature stable without any physical activity or food digestion.
The equation was developed from indirect calorimetry measurements collected between approximately 1909 and 1917 on 239 adult subjects. Harris and Benedict published their analysis in 1919 through the Carnegie Institution of Washington in the monograph titled "A Biometric Study of Basal Metabolism in Man." The expressed purpose was to establish normal metabolic standards for comparison with patients who had disease states such as diabetes, thyroid disorders, and febrile illnesses.
Why the Original 1919 Formula Was Later Revised?
The 1919 sample of 239 subjects reflected the body composition and physical activity patterns of early twentieth-century Americans. Several limitations of the original dataset created predictable errors when the equations were applied to modern populations.
The 1919 population was more physically active on average than modern sedentary adults, producing higher BMR baselines in the study sample
The male equation had an R-squared correlation coefficient of 0.64 and the female equation 0.36, indicating moderate statistical fit in the original dataset
Systematic overestimation of BMR relative to indirect calorimetry measurements was observed in later comparison studies
The original equations did not account for changes in average body composition between early and late twentieth-century populations
In 1984, Roza and Shizgal reanalyzed the original 239-subject dataset alongside an additional 98 subjects from Benedict's later publications, using updated computational methods for multiple linear regression. The revised equations produced stronger R-squared values of 0.77 for males and 0.68 for females. For all practical nutrition planning, the 1984 revised version is the correct Harris-Benedict formula to use.
What Are the Harris-Benedict Formulas?
Two versions of the Harris-Benedict formula exist: the original 1919 equations and the revised 1984 equations. Each version uses the same four inputs but applies different coefficients derived from different regression analyses of the underlying data.
Original Harris-Benedict Equations (1919) — Historical Reference Only
For males:
BMR = 66.4730 + (13.7516 x weight in kg) + (5.0033 x height in cm) - (6.7550 x age in years)
For females:
BMR = 655.0955 + (9.5634 x weight in kg) + (1.8496 x height in cm) - (4.6756 x age in years)
Revised Harris-Benedict Equations (Roza and Shizgal, 1984) — Current Standard
For males:
BMR = 88.362 + (13.397 x weight in kg) + (4.799 x height in cm) - (5.677 x age in years)
For females:
BMR = 447.593 + (9.247 x weight in kg) + (3.098 x height in cm) - (4.330 x age in years)
Coefficient Comparison: Original vs Revised
Coefficient | Original Male (1919) | Revised Male (1984) | Original Female (1919) | Revised Female (1984) |
|---|---|---|---|---|
Base constant | 66.473 | 88.362 | 655.096 | 447.593 |
Weight (kg) | 13.752 | 13.397 | 9.563 | 9.247 |
Height (cm) | 5.003 | 4.799 | 1.850 | 3.098 |
Age (years) | -6.755 | -5.677 | -4.676 | -4.330 |
The revised 1984 formula produces slightly lower BMR estimates for males and adjusts the height coefficient for females upward. Both changes reduced the systematic overestimation documented in comparison studies against indirect calorimetry.
How to Calculate BMR Using the Harris-Benedict Equation?
Applying the Harris-Benedict equation requires body weight in kilograms, height in centimeters, and age in whole years. Measurements in pounds and inches must be converted before the formula is applied.
Unit Conversion Reference
Pounds to kilograms: divide by 2.2046
Inches to centimeters: multiply by 2.54
Step-by-Step Calculation Process
Convert weight to kilograms and height to centimeters if measured in imperial units
Select the correct formula version: revised 1984 for all practical nutrition planning
Select the male or female equation
Multiply weight in kg by its coefficient (13.397 for males, 9.247 for females)
Multiply height in cm by its coefficient (4.799 for males, 3.098 for females)
Multiply age in years by its coefficient (5.677 for males, 4.330 for females)
Add the base constant to the weight and height products, then subtract the age product
Worked Example 1: Male, 30 Years Old, 80 kg, 178 cm
BMR = 88.362 + (13.397 x 80) + (4.799 x 178) - (5.677 x 30)
BMR = 88.362 + 1,071.76 + 854.222 - 170.31
BMR = 1,844.03 calories per day
Worked Example 2: Female, 35 Years Old, 68 kg, 165 cm
BMR = 447.593 + (9.247 x 68) + (3.098 x 165) - (4.330 x 35)
BMR = 447.593 + 628.796 + 511.17 - 151.55
BMR = 1,436.01 calories per day
Worked Example 3: Male, 50 Years Old, 95 kg, 183 cm
BMR = 88.362 + (13.397 x 95) + (4.799 x 183) - (5.677 x 50)
BMR = 88.362 + 1,272.715 + 878.217 - 283.85
BMR = 1,955.44 calories per day
These BMR values are not daily calorie targets on their own. Each requires multiplication by an activity multiplier before it becomes a usable TDEE estimate for nutrition planning. To compare this output against Mifflin-St Jeor and Katch-McArdle using the same inputs, use the BMR Calculator.
What Is the TDEE Output From the Harris-Benedict Equation?
Once BMR is calculated, the Harris-Benedict Principle multiplies it by one of five standard activity multipliers to produce TDEE. These multipliers convert a resting calorie estimate into a full-day energy expenditure figure that accounts for movement, exercise, and non-exercise activity thermogenesis (NEAT). For the full explanation of how TDEE components interact, visit the TDEE overview.
The Five Activity Multipliers Used With Harris-Benedict
Activity Level | Multiplier | Weekly Activity Profile | Step Count Proxy |
|---|---|---|---|
Sedentary | 1.2 | Desk job, no structured exercise | Under 5,000 steps per day |
Lightly Active | 1.375 | Light exercise 1-3 days per week | 5,000 to 7,500 steps per day |
Moderately Active | 1.55 | Moderate exercise 3-5 days per week | 7,500 to 10,000 steps per day |
Very Active | 1.725 | Hard exercise 6-7 days per week | 10,000 to 14,000 steps per day |
Extra Active | 1.9 | Daily intense training plus physical job | 14,000+ steps per day |
TDEE Outputs at All Five Activity Levels: Male Example (BMR = 1,844)
Activity Level | Multiplier | TDEE Estimate |
|---|---|---|
Sedentary | 1.2 | 2,213 calories |
Lightly Active | 1.375 | 2,535 calories |
Moderately Active | 1.55 | 2,858 calories |
Very Active | 1.725 | 3,181 calories |
Extra Active | 1.9 | 3,504 calories |
TDEE Outputs at All Five Activity Levels: Female Example (BMR = 1,436)
Activity Level | Multiplier | TDEE Estimate |
|---|---|---|
Sedentary | 1.2 | 1,723 calories |
Lightly Active | 1.375 | 1,975 calories |
Moderately Active | 1.55 | 2,226 calories |
Very Active | 1.725 | 2,477 calories |
Extra Active | 1.9 | 2,728 calories |
The TDEE figure produced by the Harris-Benedict equation represents maintenance calories: the number of calories needed each day to hold body weight stable at the stated activity level. Subtracting 400 to 500 calories from TDEE produces a fat-loss deficit. Adding 150 to 250 calories produces a lean-gain surplus. For a full breakdown of activity multiplier selection, visit the activity multipliers page.
How Accurate Is the Harris-Benedict Equation?
The revised 1984 Harris-Benedict equation is more accurate than the original 1919 version, but it still overestimates resting energy expenditure compared to measured values in modern sedentary populations. The 2005 systematic review by Frankenfield, Roth-Yousey, and Compher in the Journal of the American Dietetic Association found that Harris-Benedict overestimates BMR by an average of 50 to 80 kilocalories per day in modern adults and correctly predicts RMR within 10% for approximately 69% of subjects tested.
Comparison of Prediction Accuracy: Harris-Benedict vs Mifflin-St Jeor
The same 2005 systematic review established the following accuracy comparison between the two formulas across a range of subject groups:
Metric | Harris-Benedict (Revised 1984) | Mifflin-St Jeor (1990) |
|---|---|---|
Subjects predicted within 10% of measured RMR | Approximately 69% | Approximately 82% |
Average overestimation vs indirect calorimetry | 50-80 kcal/day | Minimal bias |
Research population | 239 subjects, early 20th century | 498 subjects, late 20th century |
ADA recommendation status | Not preferred for modern adults | Preferred formula for healthy adults |
Error in sedentary adults | 5-15% overestimation | Less than 5% overestimation |
The 13-percentage-point accuracy gap between the two formulas matters in practice. For a person with a true resting metabolic rate of 1,800 calories, a 69% accuracy rate means approximately 1 in 3 individuals receives a meaningfully inaccurate BMR from the Harris-Benedict equation. The formula's overestimation tendency produces TDEE figures higher than the individual's true energy expenditure, which narrows or eliminates planned calorie deficits.
Why Harris-Benedict Overestimates in Modern Populations?
Several structural reasons explain the overestimation pattern.
The 1919 study population was more physically active than most modern adults. Higher activity levels in the source population produce higher resting metabolic rates relative to body weight, which are baked into the formula coefficients. When those coefficients are applied to a more sedentary modern adult, the output overshoots.
The source population was smaller in absolute size and had different body composition distributions than today's populations. Modern adults are taller, heavier, and carry more adipose tissue relative to lean mass. The Harris-Benedict equation uses total body weight rather than lean body mass, and total weight at higher body fat percentages produces inflated BMR estimates because fat tissue is metabolically less active than the lean tissue composition assumed by the formula.
When Harris-Benedict Error Amplifies Through the Activity Multiplier?
A BMR overestimation of 80 calories compounds through the activity multiplier to produce a larger TDEE error.
BMR Overestimation | Multiplier Applied | Resulting TDEE Overestimation |
|---|---|---|
50 calories | 1.2 (sedentary) | 60 calories |
50 calories | 1.55 (moderately active) | 77 calories |
80 calories | 1.2 (sedentary) | 96 calories |
80 calories | 1.55 (moderately active) | 124 calories |
80 calories | 1.725 (very active) | 138 calories |
A person using Harris-Benedict TDEE as their maintenance number may be eating 77 to 138 calories more than their actual maintenance each day without realizing it. Over 12 weeks, this produces a surplus of 6,468 to 11,592 calories, which translates to approximately 0.9 to 1.6 kilograms of unintended weight gain.
Harris-Benedict vs Mifflin-St Jeor: Direct Output Comparison
The Mifflin-St Jeor equation replaced the Harris-Benedict formula as the preferred BMR prediction standard following the 1990 publication by Mifflin and St Jeor and the 2005 Journal of the American Dietetic Association systematic review. The Academy of Nutrition and Dietetics now recommends Mifflin-St Jeor as the default formula for healthy adults.
Direct BMR and TDEE Comparison Using Identical Inputs (Male, 30, 80 kg, 178 cm)
Formula | BMR Output | TDEE at 1.2 (Sedentary) | TDEE at 1.55 (Moderately Active) | TDEE at 1.725 (Very Active) |
|---|---|---|---|---|
Harris-Benedict (Revised 1984) | 1,844 calories | 2,213 calories | 2,858 calories | 3,181 calories |
Mifflin-St Jeor (1990) | 1,768 calories | 2,122 calories | 2,740 calories | 3,050 calories |
Difference (Harris-Benedict higher by) | 76 calories | 91 calories | 118 calories | 131 calories |
The 76-calorie BMR difference at this input set compounds to a 118-calorie TDEE difference at a moderately active multiplier. For a person targeting fat loss with a planned 500-calorie deficit, eating at Harris-Benedict maintenance instead of the more accurate Mifflin-St Jeor maintenance leaves them consuming 118 extra calories per day. Their actual deficit becomes 382 calories rather than 500 calories, reducing expected fat loss rate by approximately 24%.
Female Comparison (Female, 35, 68 kg, 165 cm)
Formula | BMR Output | TDEE at 1.55 (Moderately Active) | Difference |
|---|---|---|---|
Harris-Benedict (Revised 1984) | 1,436 calories | 2,226 calories | Baseline |
Mifflin-St Jeor (1990) | 1,375 calories | 2,131 calories | Mifflin is 95 calories lower |
The Mifflin-St Jeor formula produces the more physiologically accurate output for modern, non-athletically active adults. For the full Mifflin-St Jeor formula, coefficients, and worked examples, see the Mifflin-St Jeor formula page.
How Does Harris-Benedict Compare to Katch-McArdle?
The Katch-McArdle equation uses lean body mass rather than total body weight. This makes it more accurate than Harris-Benedict for individuals whose body composition differs significantly from population averages.
Harris-Benedict uses total body weight in its calculation. At higher body fat percentages, total body weight increasingly over-represents metabolically inactive fat tissue, causing the formula to overestimate BMR. This problem is most severe for individuals with body fat above 30%.
Harris-Benedict vs Katch-McArdle Output at 80 kg Male, 30 Years, 178 cm
Body Fat % | Harris-Benedict BMR | Katch-McArdle BMR | Harris-Benedict Overestimation |
|---|---|---|---|
10% | 1,844 calories | 1,925 calories | Underestimates by 81 calories |
20% | 1,844 calories | 1,753 calories | Overestimates by 91 calories |
30% | 1,844 calories | 1,580 calories | Overestimates by 264 calories |
40% | 1,844 calories | 1,407 calories | Overestimates by 437 calories |
At 40% body fat, Harris-Benedict produces a BMR estimate 437 calories above what Katch-McArdle calculates for the same individual using a measured body fat input. At a moderately active multiplier of 1.55, this creates a TDEE overestimation of 677 calories per day. A person eating at that inflated maintenance would gain weight consistently regardless of their planned deficit.
When Should You Use the Harris-Benedict Equation?
The Harris-Benedict equation (revised 1984) remains in use in specific contexts. For most individuals calculating their own TDEE for nutrition planning, it is not the first-choice formula. The following profiles define where it continues to have practical application.
Appropriate Use Cases for Harris-Benedict
Clinical settings with prior records: Hospitals and clinical nutrition programs that calculated intake targets under Harris-Benedict maintain consistency by continuing to use it when monitoring longitudinal patient data
Comparative research replication: Studies that need to reproduce results from earlier research using Harris-Benedict must apply the same formula to produce comparable output
Historical reference work: Any analysis of metabolic literature predating 1990 requires familiarity with Harris-Benedict as the operative formula of that period
Cross-check alongside Mifflin-St Jeor: Running both formulas and observing the difference can help identify outliers whose BMR is not well-predicted by either total-weight formula
When Not to Use Harris-Benedict
For self-directed fat loss or muscle gain planning, Mifflin-St Jeor produces lower error and should be the default formula when no body fat measurement is available
For athletes or individuals with measured body fat percentages significantly above or below population averages, the Katch-McArdle equation produces more accurate BMR estimates
When switching from a previous calorie tracking phase, starting a new calculation with Mifflin-St Jeor rather than Harris-Benedict prevents the systematic overestimation bias from carrying forward
For a full comparison of all three formulas and a guide to selecting the correct one for any profile, visit the TDEE formulas overview page.
How Does Body Weight Change Affect the Harris-Benedict Output?
The Harris-Benedict weight coefficients assign 13.397 calories per kilogram of body weight for males and 9.247 calories per kilogram for females. Every kilogram of body weight change produces a predictable shift in BMR and, through the multiplier, in TDEE.
BMR and TDEE Change Per Kilogram of Weight Loss or Gain
Weight Change | Male BMR Change | Male TDEE Change at 1.55 | Female BMR Change | Female TDEE Change at 1.55 |
|---|---|---|---|---|
-5 kg | -66.99 calories | -103.8 calories | -46.24 calories | -71.7 calories |
-10 kg | -133.97 calories | -207.5 calories | -92.47 calories | -143.3 calories |
+5 kg | +66.99 calories | +103.8 calories | +46.24 calories | +71.7 calories |
+10 kg | +133.97 calories | +207.5 calories | +92.47 calories | +143.3 calories |
The higher weight coefficient for males (13.397 vs 9.247) means weight changes have a larger absolute effect on male BMR and TDEE outputs. A male losing 10 kg sees a 207-calorie TDEE reduction at moderately active. A female losing 10 kg sees a 143-calorie TDEE reduction at the same multiplier.
This asymmetry reflects the average differences in body composition between males and females at equivalent body weights. Males typically carry more lean mass per kilogram of body weight, and lean mass has a higher metabolic rate per kilogram than fat mass.
Standard practice is to recalculate both BMR and TDEE every three to four kilograms of body weight change. Using a TDEE figure calculated at a previous higher weight progressively widens the gap between estimated and actual energy expenditure. For ongoing TDEE tracking, the TDEE Calculator recalculates automatically with updated weight inputs.
How Does Age Affect the Harris-Benedict Equation Output?
The Harris-Benedict equation applies an age coefficient that reduces BMR by 5.677 calories per year for males and 4.330 calories per year for females. This coefficient reflects the gradual decline in resting energy expenditure associated with aging, primarily driven by progressive loss of lean muscle mass (sarcopenia) and reductions in organ metabolic activity.
BMR Decline by Decade: Male, 80 kg, 178 cm (Revised 1984 Formula)
Age | Harris-Benedict BMR | TDEE at 1.55 | Cumulative BMR Reduction from Age 25 |
|---|---|---|---|
25 | 1,872.40 calories | 2,902 calories | Baseline |
35 | 1,815.63 calories | 2,814 calories | -56.8 calories |
45 | 1,758.85 calories | 2,726 calories | -113.6 calories |
55 | 1,702.08 calories | 2,638 calories | -170.3 calories |
65 | 1,645.30 calories | 2,550 calories | -227.1 calories |
The 5.677-calorie-per-year reduction produces a cumulative 56.8-calorie BMR reduction per decade for males. At moderately active multiplier, this translates to an 88-calorie TDEE reduction per decade. Over four decades, a male who does not recalibrate their calorie intake downward as they age would need to eat 352 fewer calories per day at 65 than at 25 just to maintain stable body weight, assuming all other variables remain constant.
The age coefficient is slightly lower in Harris-Benedict than the age effect observed in Mifflin-St Jeor, which reduces BMR by 5 calories per year. Both formulas capture the general aging trend but may underestimate BMR decline in individuals over 65 who have experienced significant muscle mass loss beyond average sarcopenia rates.
What Are the Limitations of the Harris-Benedict Equation?
The Harris-Benedict equation has four structural limitations that explain why it was supplanted by Mifflin-St Jeor as the recommended formula and why Katch-McArdle performs better at body composition extremes.
Limitation | Effect on Output | Magnitude |
|---|---|---|
Uses total body weight, not lean body mass | Overestimates BMR at high body fat; underestimates at very low body fat | 91 to 437 cal error at BMR level for 80 kg male (20%-40% BF range) |
Derived from early 20th century study population | Coefficients reflect more active ancestral population; produces systematically high outputs for sedentary modern adults | 50-80 kcal/day average overestimation per 2005 JADA review |
No body fat percentage input | Cannot adjust BMR for individuals with atypical body composition | Up to 677 cal TDEE error at high body fat percentages |
Lower individual accuracy rate than Mifflin-St Jeor | Correctly predicts RMR within 10% for ~69% of subjects vs 82% for Mifflin | 13 percentage point accuracy gap |
None of these limitations make the equation unusable. They define the conditions under which its outputs will be less reliable. For a general healthy adult with no body fat measurement, Mifflin-St Jeor reduces error by a meaningful margin with no additional data requirement. For an individual with a measured body fat percentage at either extreme, Katch-McArdle eliminates the total-weight limitation entirely. The relationship between BMR and the full TDEE calculation is explained in detail on the TDEE vs BMR page.
Frequently Asked Questions About the Harris-Benedict Equation
Which version of the Harris-Benedict equation should I use?
Use the revised 1984 version published by Roza and Shizgal. The original 1919 version produced higher BMR overestimation than the revised version and should be treated as a historical reference only. All practical nutrition planning and clinical work uses the 1984 revised coefficients.
Why does the Harris-Benedict equation overestimate BMR?
The original equation was derived from 239 subjects studied between 1909 and 1917. That population was more physically active than modern sedentary adults, producing higher resting metabolic rates per kilogram of body weight than those seen in current populations. The formula coefficients reflect that more active baseline. When applied to a less active modern adult, the output exceeds the measured resting metabolic rate by 50 to 80 calories per day on average.
Is Harris-Benedict accurate enough for fat loss planning?
It produces usable estimates, but with a known upward bias. The 2005 Journal of the American Dietetic Association systematic review found Harris-Benedict correctly predicted RMR within 10% for approximately 69% of subjects.
For the remaining 31%, the error is large enough to meaningfully reduce planned deficits. For fat loss planning where accuracy matters, Mifflin-St Jeor is the more reliable starting point.
What is the difference between Harris-Benedict and Mifflin-St Jeor?
Both formulas use weight, height, age, and sex to estimate BMR. Harris-Benedict uses higher coefficients derived from a 1919 study population and consistently overestimates BMR by 50 to 80 calories per day in modern sedentary adults. Mifflin-St Jeor was developed from a 1990 study of 498 adults whose body composition better represents current populations.
The Academy of Nutrition and Dietetics recommends Mifflin-St Jeor as the standard for healthy adults. At the same inputs, Harris-Benedict produces a TDEE estimate approximately 90 to 130 calories higher than Mifflin-St Jeor.
Should I switch from Harris-Benedict to Mifflin-St Jeor?
If you have been tracking calories using Harris-Benedict and have not been losing weight as expected, switching to Mifflin-St Jeor will produce a lower TDEE estimate. For most sedentary to moderately active adults, the Mifflin-St Jeor output is closer to true maintenance.
Validate whichever TDEE figure you use by tracking food intake and body weight simultaneously for two to three weeks before treating it as confirmed.
How often should I recalculate using Harris-Benedict?
Recalculate every three to four kilograms of body weight change or every four to six weeks during an active diet or training phase. The Harris-Benedict weight coefficient (13.397 for males, 9.247 for females) means a 5 kg weight change shifts male TDEE by approximately 104 calories per day. Without recalculation, the planned calorie target progressively diverges from actual maintenance.