
How Age Affects TDEE at Every Decade?
TDEE does not decline steadily from your twenties onward. A 2021 study in Science measuring 6,421 people found fat-free mass adjusted energy expenditure stays flat from 20 to 60. This guide covers the real decade-by-decade numbers and what actually drives the later decline.

Your body has a number. Let's find it.
We calculate the exact calorie target your body needs, built from your stats and goal, then track everything against it daily. Log meals, add workouts, set a weight goal, and watch your numbers update in real time. Check in weekly to see calories, water, and weight trend in one place.
No spreadsheets. No guessing. Just results.
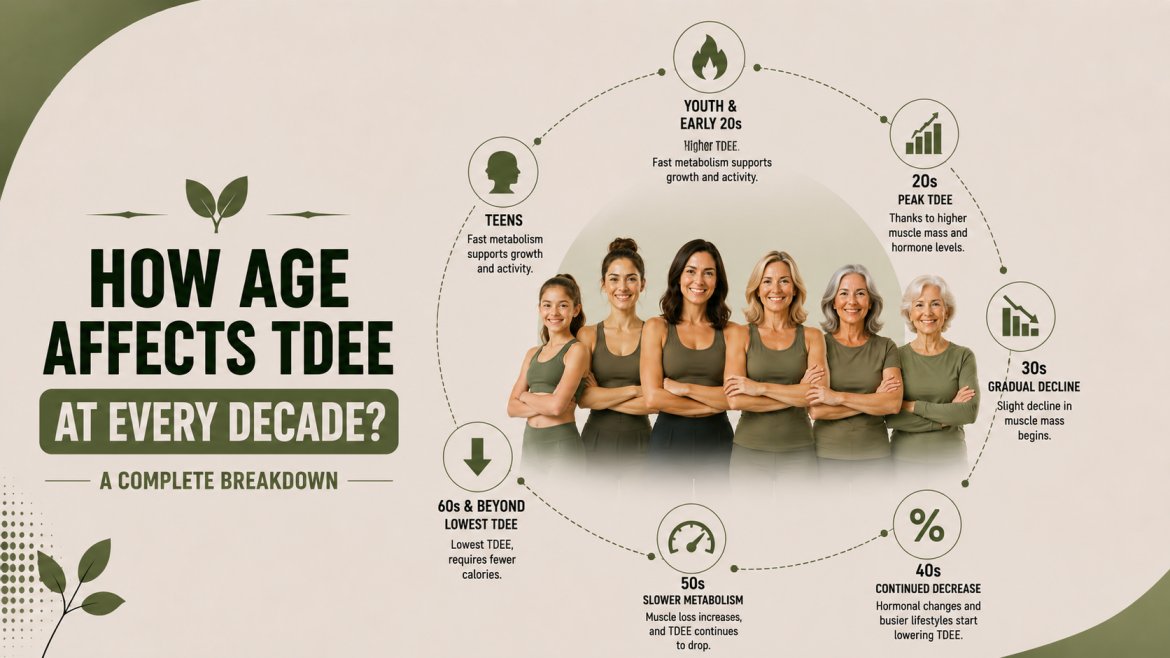
TDEE does not decline steadily from your twenties onward, despite the common belief. The decline most adults expect in their thirties and forties does not appear in the largest dataset ever assembled on the subject.
A 2021 study in Science by Herman Pontzer and colleagues measured total energy expenditure in 6,421 people aged 8 days to 95 years. The results reshaped how much weight to give a formula-based TDEE calculator at any given decade of life.
This guide covers what that study found and the real numbers by decade. It also covers why the genuine decline begins after 60, and how menopause interacts with the broader age-related pattern.
Does TDEE Decline With Age?
TDEE changes with age, but not in the way most people assume. The relationship is not a steady downward slope starting in early adulthood.
Life Stage | Common Assumption | What the Data Shows |
|---|---|---|
20s to 30s | Metabolism starts slowing | Essentially flat |
40s to 50s | Noticeable decline begins | Still essentially flat |
60s | Modest decline | Genuine decline begins here |
70s and beyond | Significant decline | Decline continues, accelerates further |
The gap between assumption and data matters practically. Someone in their 40s blaming a stalled diet on age-related metabolic slowdown is very likely looking at the wrong cause.
That cause is often one of several worth ruling out among every factor covered in this cluster.
What Did the 2021 Pontzer Study Find?
The study used doubly labelled water, widely considered the gold standard for measuring real-world energy expenditure outside a laboratory. Subjects drink water with labelled hydrogen and oxygen isotopes, and researchers track elimination rates to calculate total energy use over roughly two weeks.
Study Detail | Figure |
|---|---|
Total subjects | 6,421 |
Age range | 8 days to 95 years |
Method | Doubly labelled water |
Publication | Science, 2021 |
Lead author | Herman Pontzer, Duke University |
Doubly labelled water measures real-world total expenditure directly, unlike the formula-based approach the complete TDEE guide explains for everyday calculation.
The finding that overturned prior assumptions was specific to fat-free mass adjusted expenditure. Once researchers accounted for lean body mass, energy expenditure per kilogram of fat-free mass stayed essentially constant from age 20 to age 60.
In practice: This means an active, muscular 55-year-old and an equally active, equally muscular 25-year-old burn very similar calories per kilogram of lean tissue. Apparent metabolic slowdown in this range usually traces to lost muscle or reduced activity, not age itself.
TDEE by Decade: 20s Through 70s
Applying the Pontzer findings alongside standard body composition trends gives a realistic picture of what actually changes decade by decade.
Decade | TDEE Trend | Primary Driver of Any Change |
|---|---|---|
20s | Peak or near-peak | Baseline muscle mass, high activity common |
30s | Flat | No metabolic decline; lifestyle activity often drops |
40s | Flat | Same as 30s; muscle loss may begin without training |
50s | Flat, women see hormone shift | Perimenopause begins affecting some women |
60s | Decline begins | Tissue-level metabolic changes start |
70s | Continued decline | Sarcopenia accelerates, activity often drops further |
The 30s and 40s rows are the ones most people get wrong. Nothing in the metabolic data explains a slowdown in this range. What typically happens instead is a combination of reduced daily activity and gradual, undiagnosed muscle loss from inactivity.
Why Does TDEE Drop After 60?
The genuine decline after 60 is driven by tissue-level metabolic changes rather than lifestyle alone. Pontzer's data showed energy expenditure per kilogram of fat-free mass declining by roughly 0.7% per year past that threshold.
Three mechanisms combine to produce this pattern. Individual variation in these mechanisms also has a genetic component, covered separately in the genetics and metabolism guide.
Sarcopenia accelerates past 60, removing metabolically active tissue faster than in earlier decades
Organ-level metabolic rate, particularly in the liver and kidneys, declines independent of muscle mass
Cellular efficiency changes reduce the energy cost of maintaining existing tissue
Where sarcopenia fits: Muscle loss is the single largest lever within this age-related decline, since lean tissue drives a disproportionate share of resting energy use. The full mechanism behind muscle loss and TDEE covers the rate of decline and how to slow it through training.
Checking your resting rate directly with a BMR calculator is a useful cross-check against the formula estimate at any age.
How Does Menopause Change TDEE?
Menopause introduces a hormone-driven shift on top of the general age-related pattern. This adds an earlier, more female-specific decline than the Pontzer data alone would predict.
This is one piece of the broader hormone picture covered in the hormones and TDEE guide.
Stage | Typical Effect on TDEE | Primary Mechanism |
|---|---|---|
Premenopause | Baseline | Normal reproductive hormone cycling |
Perimenopause | -100 to 200 kcal/day | Oestrogen begins declining |
Postmenopause | -150 to 200 kcal/day, sustained | Oestrogen stabilises at low level |
Declining oestrogen independently reduces lean muscle mass beyond what age alone would predict. Since muscle is metabolically active tissue, that additional loss compounds the direct hormonal effect on resting burn.
The full breakdown of TDEE during menopause covers the transition in detail, including which interventions have real evidence behind them.
How Do You Adjust for Age-Related TDEE Change?
A standard calculator already includes age as a direct input, so the formula partially accounts for typical age-related change. Two adjustments improve accuracy further for people past 50.
Recalculate every 6 to 12 months rather than treating one calculation as permanent
Track body composition alongside weight, since lean mass loss is the mechanism most worth catching early
Use the Katch-McArdle formula once body fat percentage is known, since it calculates from lean mass directly rather than age and weight alone
Prioritise resistance training regardless of current activity level, since it is the strongest available lever against the sarcopenia driving most of the post-60 decline
Formula choice matters more with age. Mifflin-St Jeor uses age as a direct variable but cannot see individual differences in lean mass at a given age. Two 65-year-olds at the same height and weight can have meaningfully different true TDEE depending on how much muscle each one has retained.
The best TDEE calculators review covers which tools let you switch formulas as your situation changes.
How Does Age Affect Men and Women Differently?
Age-related TDEE change follows a broadly similar pattern in both sexes through the flat 20-to-60 window the Pontzer data describes. The divergence appears specifically around midlife hormone transitions.
Factor | Men | Women |
|---|---|---|
Timing of hormone-driven decline | Gradual, no sharp transition | Concentrated around perimenopause |
Typical magnitude | Modest, tied to testosterone decline | 150 to 200 kcal/day around the transition |
Lean mass trajectory | Gradual loss from ~30 onward | Accelerates specifically at menopause |
Post-60 decline | Follows Pontzer pattern | Follows Pontzer pattern, layered on menopause effect |
Testosterone decline in men, sometimes called andropause, is gradual and lacks the concentrated hormonal transition that defines female menopause. This produces a smoother age-related curve for men rather than the step change many women experience in their late 40s to early 50s.
In practice: A 50-year-old woman and a 50-year-old man at the same starting TDEE are likely to see meaningfully different trajectories over the following decade, even at identical body composition and activity levels.
Frequently Asked Questions About Age and TDEE
At What Age Does Metabolism Start Slowing Down?
Based on the 2021 Pontzer study in Science, fat-free mass adjusted energy expenditure stays essentially flat from age 20 to 60. The genuine decline begins after 60, driven by tissue-level metabolic changes rather than the gradual slowdown commonly assumed to start decades earlier.
Why Do I Feel Like My Metabolism Slowed in My 30s or 40s?
The metabolic data does not support a slowdown in this range. The more common explanation is reduced daily activity or undiagnosed gradual muscle loss from inactivity. Eating slightly more than in earlier years without adjusting for it is another frequent cause.
How Much Does TDEE Decline After 60?
Pontzer's data found energy expenditure per kilogram of fat-free mass declining by roughly 0.7% per year past 60. For a 2,000 kcal TDEE, that is approximately 14 calories per year, compounding to a meaningful figure over a full decade.
Does Menopause Lower TDEE More Than Normal Aging?
Yes, in the years around the transition specifically. Perimenopause and early postmenopause typically add a 150 to 200 kcal daily reduction on top of any general age-related change. Oestrogen decline and its effect on lean mass drive that gap. The pattern differs meaningfully from male ageing, covered in the TDEE for women guide.
Should Older Adults Use a Different TDEE Formula?
Katch-McArdle calculates from lean body mass rather than age and weight. It tends to produce more accurate estimates for older adults, whose muscle mass varies more from population averages than younger adults.
Can Resistance Training Reverse Age-Related TDEE Decline?
Resistance training cannot reverse the organ-level and cellular changes behind the post-60 decline. It does directly counter sarcopenia, the largest single driver, and rebuilding lost muscle mass at any age raises resting energy use proportionally.